Boards
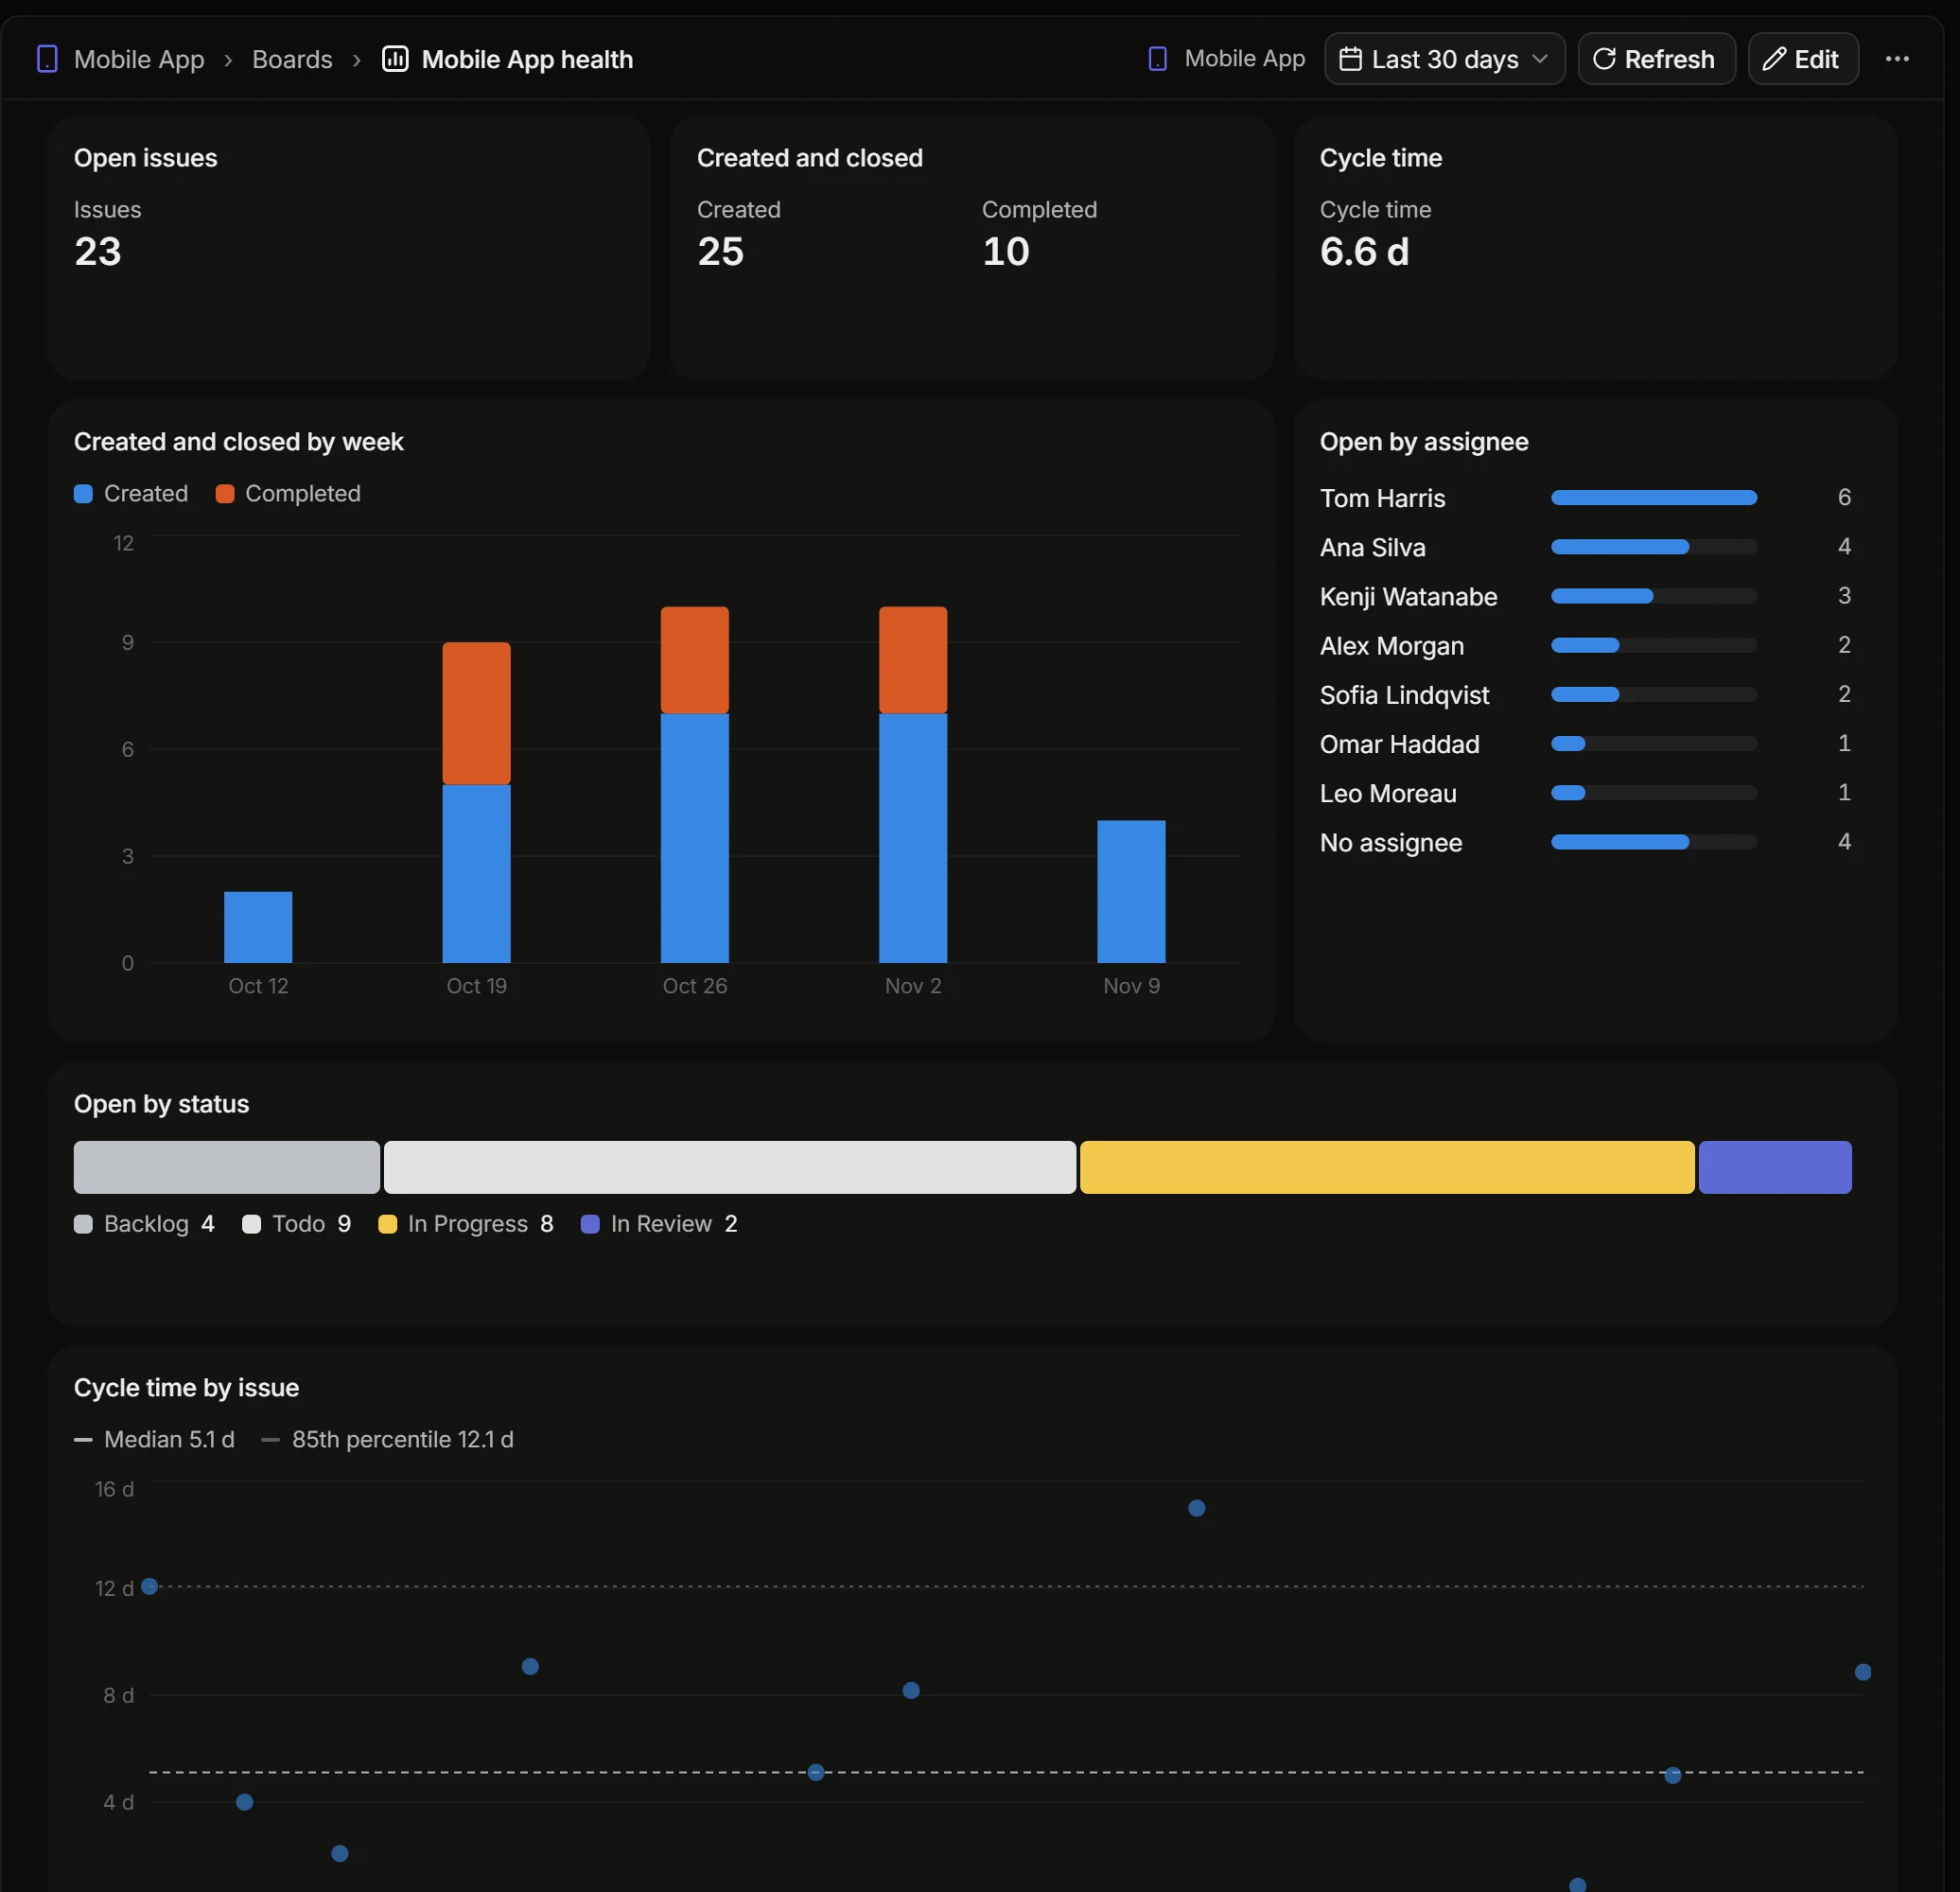
A board is a page of charts: open issues, cycle time, a sprint’s burn-up, hours by person.
Create a board
Open Boards, in the workspace or in a project, and press New board.
- Name.
- Visibility. Only you, everyone in the workspace, or the members of one project.
- Start with. An empty board or a template:
| Template | What is on it |
|---|---|
| Project health | Open issues, created and closed, cycle time, open issues by assignee and by status, cycle time by issue |
| Current sprint | The sprint’s burn-up, what is left by assignee, the sprint by status |
| Team workload | Open issues by project and by assignee, closed by week and assignee |
| Time | Hours by project, person and day, logged hours against the norm, reports by person, issue and project |
The period
A board has one period for all of its charts, chosen at the top: the last 7, 14 or 30 days, 8 or 12 weeks, 6 months, a year, or since a date. Refresh counts everything again.
Add and change charts
Press Edit, then Add chart. A chart is described by a few choices:
- Shows as: a number, meters, parts of a whole, bars, lines, points, a heatmap, a funnel or a table.
- Data: issues or logged time.
- Counts: what is measured. For issues: how many, created, completed, scope, estimate, cycle time, lead time and age, the last three also as the 85th percentile. For time: hours logged, hours in meetings, and the norm.
- By and Split by: what the numbers are grouped by: a day, week or month, a status, assignee, priority, label, project, sprint or track, or whether the issue was delegated to an agent. For example, completed issues by week, split by assignee.
- Filters: a project, an assignee, a sprint, only open issues.
In edit mode you can also move, resize and remove the charts.
Charts from Volt AI
When Volt AI answers with a chart, Add to board under it puts the chart on a board of yours, where it keeps counting.
Tables as files
A table on a board has Download CSV.